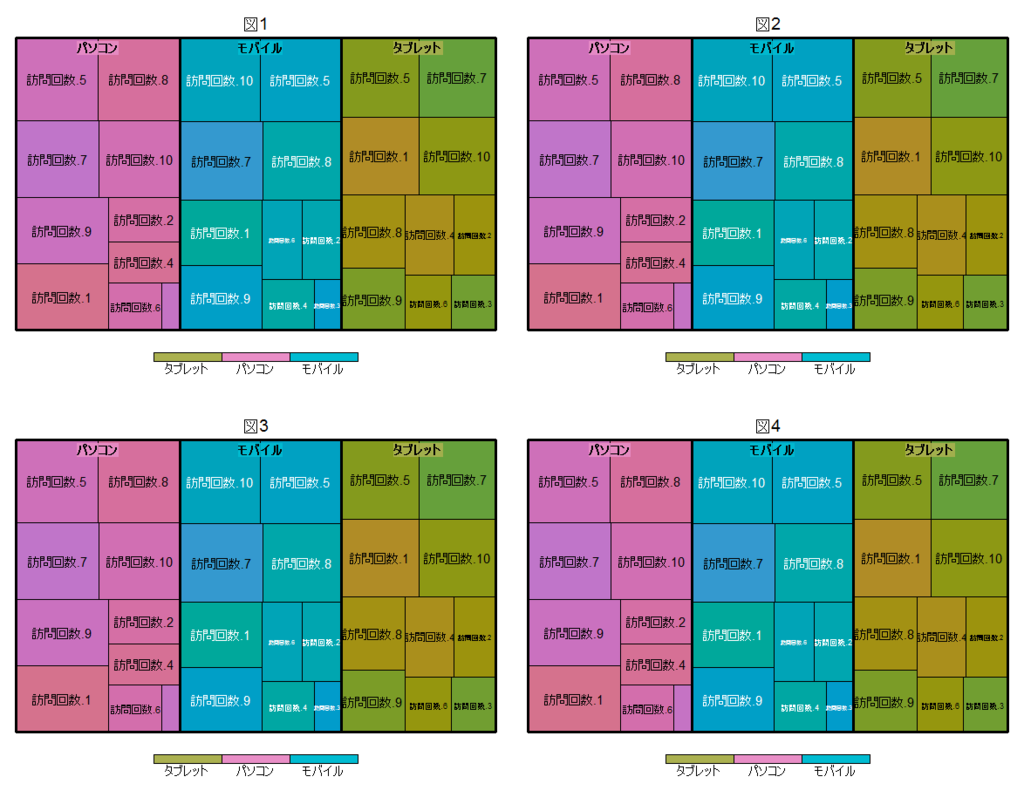
Rでtreemapツリーマップを複数(grid)表示する To display multiple for treemap of R by grid.
Rでtreemapを利用したい時「Package ‘treemap’」が存在しているのでそれを利用できる。[参考1,3]
There is a package for treemap of R.
ただし、1画面に複数の図を表示したい時、plotで利用する par() 関数はtreemapでは利用できないのでgridを利用して表示する。
If you want to display multiple that figure, you should use not the "par()" function , but the "grid" library .
treemap()関数のdocument[参考3]に以下の引数があるのでこれを利用する。
According to the document of treemap(), you can use a argument that is named "vp".

このvpに表示先のviewportを指定することで複数表示が可能。
Sample
#パッケージの読み込み
library("treemap")

#データ例の作成
n <- 300
TestData <- data.frame(index1 = rep(c("パソコン", "モバイル", "タブレット"), each = 9, length = n),
                       index2 = paste0("訪問回数.", sample(1:10, 30, replace = TRUE)),
                       data = sample(5:30, n, replace = TRUE))
#gridの準備
library(grid)
grid.newpage()
pushViewport(viewport(layout=grid.layout(2, 2)))

#図1 row=1 col=1
treemap(TestData, index = names(TestData)[1:(ncol(TestData)-1)], title = "図1",
        vSize = "data", align.labels = list(c("center", "top"), c("center", "center")),
        position.legend = "bottom", vp = viewport(layout.pos.row=1,layout.pos.col=1))

#図2 row=1 col=2
treemap(TestData, index = names(TestData)[1:(ncol(TestData)-1)], title = "図2",
vSize = "data", align.labels = list(c("center", "top"), c("center", "center")),
        position.legend = "bottom", vp = viewport(layout.pos.row=1,layout.pos.col=2))

#図3 row=2 col=1
treemap(TestData, index = names(TestData)[1:(ncol(TestData)-1)], title = "図3",
        vSize = "data", align.labels = list(c("center", "top"), c("center", "center")),
        position.legend = "bottom", vp = viewport(layout.pos.row=2,layout.pos.col=1))

#図4 row=2 col=2
treemap(TestData, index = names(TestData)[1:(ncol(TestData)-1)], title = "図4",
        vSize = "data", align.labels = list(c("center", "top"), c("center", "center")),
        position.legend = "bottom", vp = viewport(layout.pos.row=2,layout.pos.col=2))

※サンプルは[参考1,2]のコードを改修し利用させていただいている。
参考:
1.Rとウェブ解析:ツリーマップの作成が簡単です!「treemap」パッケージの紹介
2.【R】ggplot2で複数のグラフを一つ図として表示&保存する方法 | 楽楽研究室
3.https://cran.r-project.org/web/packages/treemap/treemap.pdf